


BPCC-104 IGNOU Solved Assignment 2026-27
Click to view offer details & terms
Get 10% OFF Instant Discount
Apply this coupon code at checkout to claim your academic discount instantly.
- Applicable on all university study materials
- Valid for up to 8 item(s) per order
- Valid till Oct 31, 2026
Frequently Bought Together
Popular course materials frequently ordered together
Syllabus & Overview
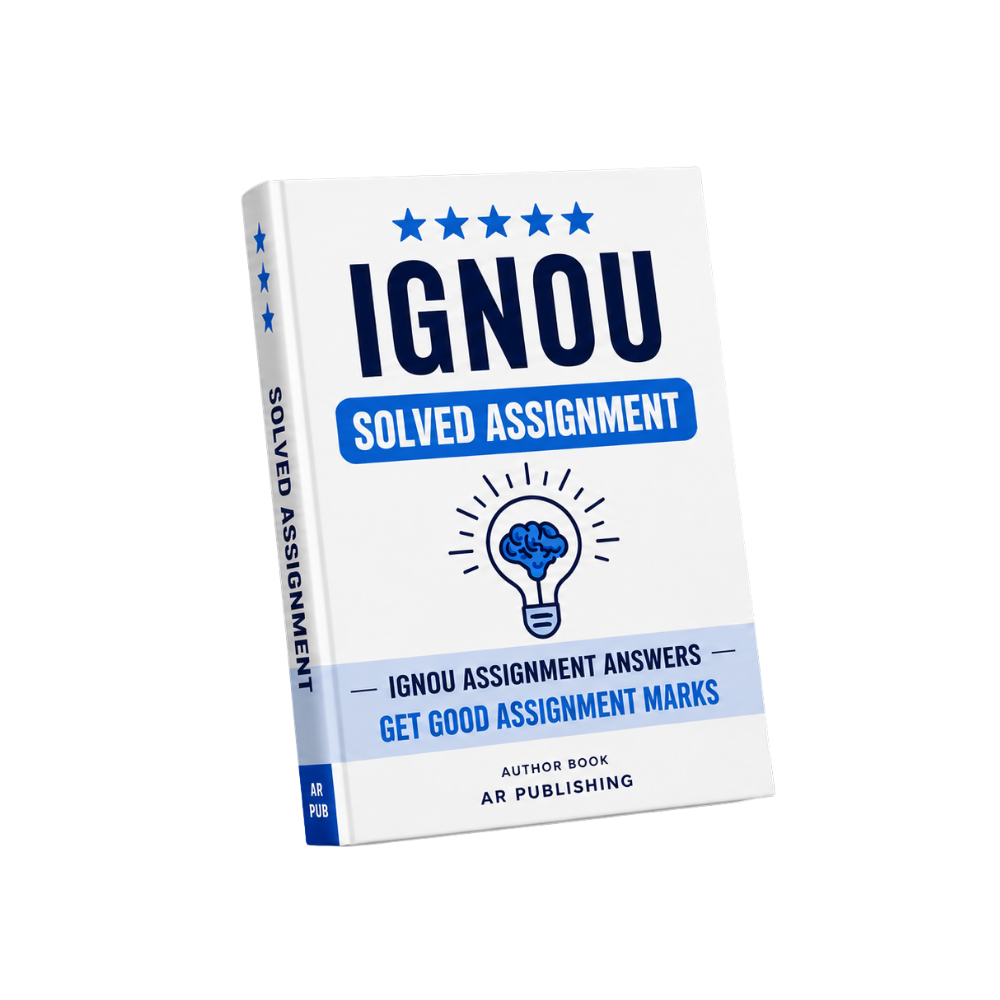
BPCC-104 Solved Assignment: Statistical Methods for Psychological Research-I (TMA Solutions)
This digital PDF covers the mandatory 30% course weightage for BPCC-104, offering 100% verified solutions aligned with the IGNOU Bachelor of Arts (BAM) syllabus. All answers strictly adhere to word limits (500/250/100 words) and current submission deadlines for the academic session.
Key Syllabus Units Covered
- Block-1: Introduction to Statistical Methods
- Definition and scope of statistics in psychological research (descriptive vs. inferential).
- Steps in statistical analysis: data collection, organization, and interpretation.
- Role of statistical methods in hypothesis testing and research design.
- Block-2: Measures of Central Tendency and Variability
- Calculations for mean, median, and mode with psychological data examples.
- Range, variance, and standard deviation with step-by-step formulas.
- Interpretation of skewness and kurtosis in behavioral science studies.
- Block-3: Correlation
- Pearson’s and Spearman’s correlation coefficients with case studies.
- Assumptions and limitations of correlation analysis in psychology.
- Difference between correlation and causation in behavioral research.
- Block-4: Normal Probability Distribution
- Properties of the normal curve and its applications in psychological testing.
- Z-scores and standard normal distribution tables for data interpretation.
- Hypothesis testing using the normal distribution in research.
Sample FAQs
- Q: How do I calculate the mean for ordinal data in psychology?
For ordinal data, the mean is typically calculated by assigning numerical values to categories (e.g., Likert scale) and then computing the arithmetic mean. However, non-parametric alternatives like the median are preferred when data normality is questionable.
- Q: What is the significance of standard deviation in behavioral research?
The standard deviation measures the dispersion of data points from the mean, indicating variability in responses (e.g., anxiety scores). A higher SD suggests greater heterogeneity in participant behavior, influencing effect size calculations.
Assignment Structure
Each question is solved with:
- Step-by-step statistical derivations (e.g., variance formula:
σ² = Σ(Xi X̄)² / N). - Psychological relevance (e.g., applying correlation to personality trait studies).
- Word limit compliance (e.g., 500 words for Block-1 questions).
Why buy from us?
-
Verified by top professors and 99th percentile students.
-
Always updated to the latest university curriculum.
-
High-quality, printable PDF formats with clear diagrams.
License & Terms
By purchasing this item, you agree to our standard academic license terms. You may use this product for personal study, but you may not resell or redistribute the files online.